plotsrv


plotsrv turns Python objects into live browser views with minimal code.
Tables, plots, JSON, HTML, logs, images, tracebacks, and files can be surfaced through a browser UI designed for scripts, pipelines, experiments, batch jobs, and long-running processes.
Live demo: https://demo.plotsrv.com
See a deployed example showing real sensor data.
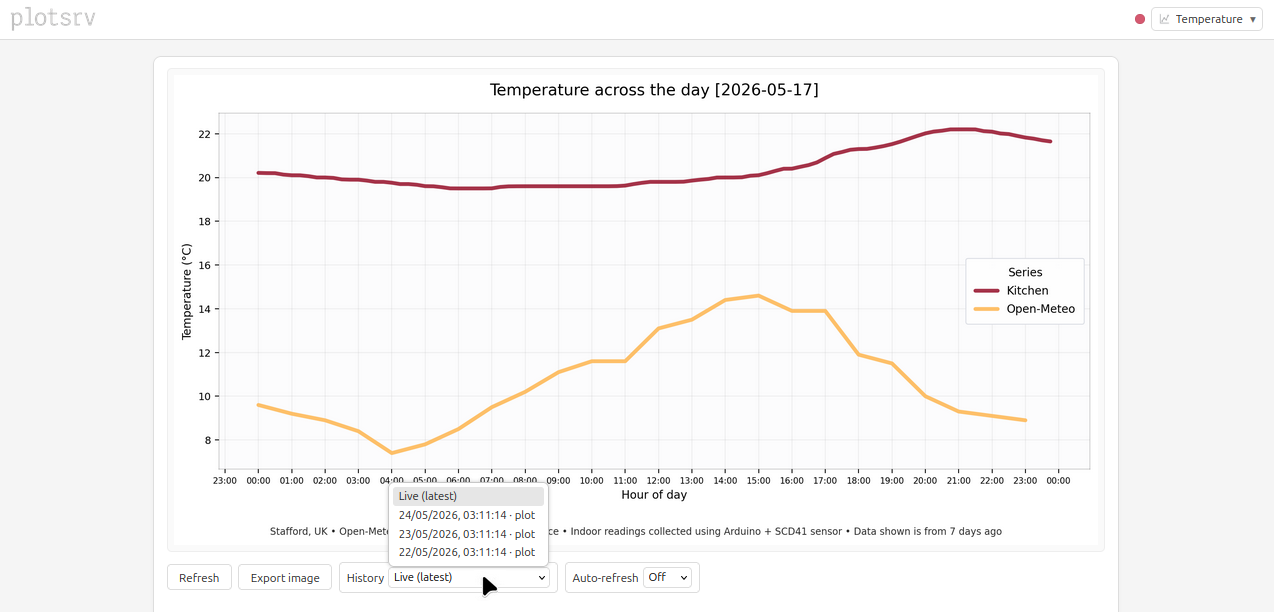
Wrap a content-producing function with @ps.view(...), or publish an object directly with ps.publish_view(...).
Your code continues to run normally, while plotsrv publishes the returned objects into a browser UI. Labels and sections organise related outputs into a connected interface, giving scripts and pipelines lightweight observability with historical snapshots, freshness indicators, rich renderers, and more.
Who is it for?
plotsrv is for Python users who want more visibility into scripts, pipelines, experiments, and batch processes without building dashboards or manually producing lots of on-disk artifacts.
It is useful when outputs are currently hidden in terminal logs, scattered across files, or difficult to inspect visually. For example:
- checking pipeline outputs while a job runs
- surfacing validation summaries, plots, tables, and status objects
- going beyond a text log file buried on disk
- inspecting data visually from a headless or remote server
- creating a lightweight observability surface for internal scripts and jobs
plotsrv is not intended to replace heavier observability or experiment-tracking platforms such as Grafana, Prometheus, MLflow, or Weights & Biases.
Its strength is that it can directly render a wide range of ordinary Python objects with very little setup, making it useful in the space between print() statements, log files, notebooks, dashboards, and full observability stacks.
More than a viewer
Beyond simply rendering outputs, it can:
- organise related views into sections
- track freshness and staleness
- watch files on disk
- retain historical snapshots
- compare current and previous outputs
- restore persisted views after restart
- provide rich renderers for tables, plots, HTML, JSON, tracebacks, and more
Where to start
New to plotsrv?
- Quick Start — publish a first view
- What is plotsrv? — A brief overview of plotsrv and it's features.
Exploring features
- Renderers — tables, plots, JSON, HTML, markdown, images, tracebacks, and files
- Storage & History — snapshots and historical browsing
- Freshness — monitor when outputs become stale
- Configuration — control plotsrv behaviour
Is it reliable?
plotsrv is developed with automated testing as a core part of the project.
Coverage includes:
- unit and integration testing
- end-to-end tests
- benchmark tests
- automated example pipelines using a dedicated examples repository
Note
More information is available on the Testing & Benchmarks page.
Next step
Continue to Quick Start.