What is plotsrv?
plotsrv is a lightweight observability platform for surfacing live outputs from Python processes through a browser UI.
It gives a Python process somewhere useful to publish:
- tables
- plots
- JSON-like objects
- logs
- markdown
- HTML
- images
- tracebacks
- files on disk
Many useful outputs already exist in memory while a script, job, pipeline, or experiment runs. plotsrv makes those objects visible and inspectable with very little extra code.
It can also be used deliberately: publish status objects, validation summaries, generated reports, intermediate results, or ordinary Python objects, and plotsrv will render them with an appropriate viewer.
Those viewers provide useful inspection features where possible, such as search, filtering, expansion, browsing, and history.
In short: plotsrv gives Python processes cheap observability.
A small example
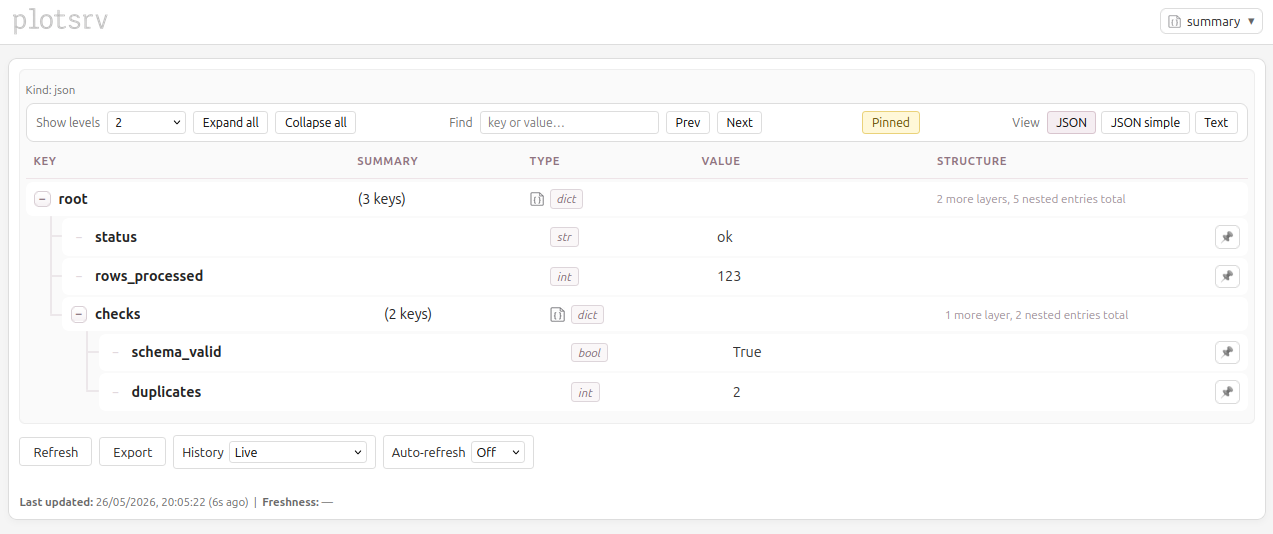
To publish a nested Python dictionary into the UI:
import plotsrv as ps

summary = {
    "status": "ok",
    "rows_processed": 123,
    "checks": {
        "schema_valid": True,
        "duplicates": 2,
    },
}

ps.publish_view(
    summary,
    label="summary",
    launch_server=True,
)
Open:
plotsrv will render the object as structured JSON.
What it is for
plotsrv is useful when a Python process already produces useful objects such as plots, tables, HTML reports, logs, metrics, or intermediate results, and there is value in exposing those outputs through a lightweight live UI with minimal additional code.
Common cases include:
- checking outputs from an ETL job
- viewing/exploring a DataFrame on a server
- inspecting JSON-like status objects
- publishing plots during experimentation
- watching log files and generated artifacts
- seeing whether a repeated process is fresh or stale
- keeping recent snapshots of outputs
What it is not
plotsrv is not intended to replace:
- a dashboard framework
- a BI tool
- a public web application framework
Ways to use it
For quick interactive use, start an attached server from Python:
For scripts, jobs, and pipelines, start plotsrv separately:
Then publish to that running server using publish_view or @view:
Next step
Continue to Installation.